Combined Client Samples
Each machine in the fleet writes its own small pile of sample files — where it stepped,
where it died, which way it moved, and how its walks were distributed in length and reach. The
combine toolset sums those piles across every client into one set of
combined_*.csv files: the uncensored truth over every walk ever run, not just the
interesting tail the library keeps. This board is the reading room for that merged set — rendered as
charts, graphs and tables from a single pre-computed snapshot.
How long the walks live
combined_pathlengthdistro.csvEvery walk steps to a random unvisited neighbour until it seals itself in and can go no further. The number of steps it managed is its length. Summed over the whole fleet, that distribution is steeply skewed: most walks suffocate early, a thin tail runs for thousands of steps. The chart below plots the count of walks at each length across the full range (log count-axis so the tail stays visible); the mean is the fleet's trapping length.
| Statistic | Steps |
|---|---|
| Mean (trapping length) | 209.71 |
| Median (p50) | 170 |
| Mode (most common) | 90 |
| p90 | 415 |
| p99 | 735 |
| p99.9 | 1,046 |
| Maximum | 3,644 |
How far they get
distance · reach · ManhattanLength counts steps; these three measure ground covered. End-to-end distance is the straight line from where a walk began to where it died; farthest reach is the largest radius it ever touched (always ≥ the end distance, since walks often loop back before trapping); Manhattan distance is the grid-blocks-home figure. Each is a full-population histogram with its median marked.
median 19 · mean 23.4 · max 427
straight-line radius from origin to the death point
median 27 · mean 31.3 · max 446
the largest radius the walk ever attained
median 24 · mean 29.9 · max 583
|dx|+|dy| at death — steps-on-a-grid distance home
Which way they step
combined_pathdirections.csvThe walk chooses uniformly among its free neighbours, so nothing in the process prefers a heading. Fairness therefore demands the pattern be invariant under a 90° turn — the four orthogonal counts equal each other, and the four diagonal counts equal each other. That four-fold symmetry is the real audit of the random stream; a dent in one direction is a bug caught in the act. It does not demand that straight and diagonal steps match: which of those a walk can take depends on the trail it has already laid, and here diagonals come out about 6.3% more often — geometry, not a biased generator.
| Direction | Δx,Δy | Group | Count | Share | Δ within group |
|---|---|---|---|---|---|
| E | 1,0 | orthogonal | 12.08T | 12.116% | +0.0000% |
| SE | 1,1 | diagonal | 12.85T | 12.884% | +0.0000% |
| S | 0,1 | orthogonal | 12.08T | 12.116% | +0.0000% |
| SW | -1,1 | diagonal | 12.85T | 12.884% | +0.0000% |
| W | -1,0 | orthogonal | 12.08T | 12.116% | +0.0000% |
| NW | -1,-1 | diagonal | 12.85T | 12.884% | 0.0000% |
| N | 0,-1 | orthogonal | 12.08T | 12.116% | 0.0000% |
| NE | 1,-1 | diagonal | 12.85T | 12.884% | 0.0000% |
Where they wander, where they die
90×90 heat over a 4K² worldEvery cell any walk stepped on (left) and every cell a walk finally trapped itself on (right), summed over the fleet and binned into a coarse grid. The dashed crosshair is the world centre, where all walks begin. Colour is on a log scale — a single bright core fanning out into an ever-sparser frontier. The two fields share a shape because walks mostly die where they mostly wander.
The burst
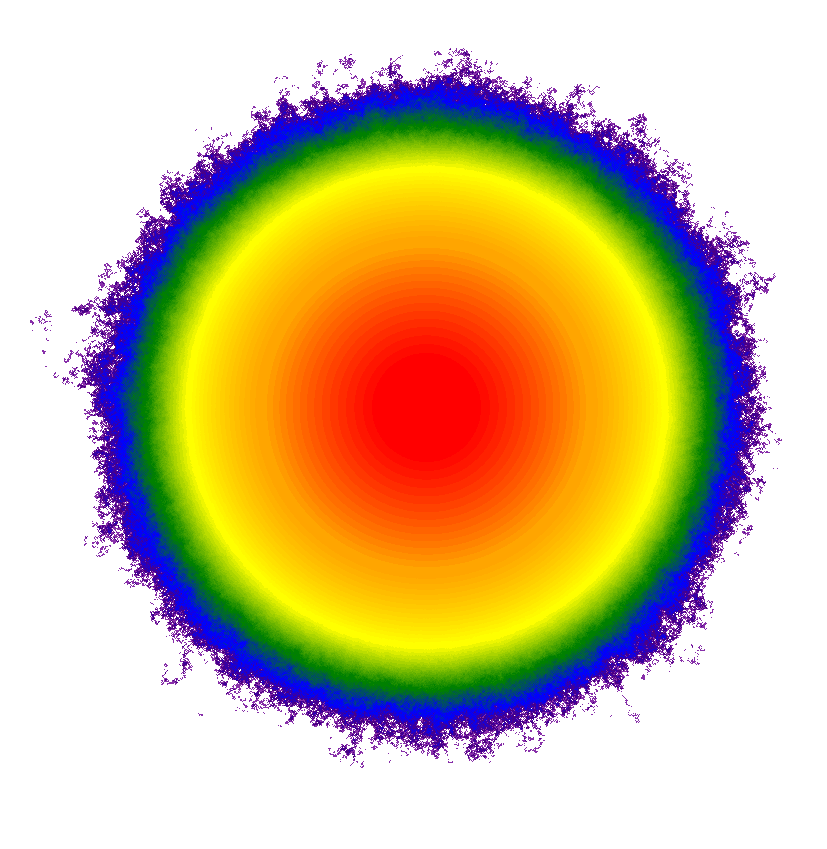
405.1K cells · 11 spectrumsThe wander field from Section IV at full resolution — every one of the 405.1K cells any walk stepped on, over the 4K² world, painted by visit frequency on a log-of-max scale. This is the image that brands the project; the ladder at left recolours the identical data through each spectrum. Transparent means never visited — the checker shows through.
The longest walks
combined_top_20_path_lengths.csvEach client keeps its own top-20 lengths; the combine step merges them into a fleet-wide leaderboard, scoring by rank position across all clients so a length that lands high on many machines outranks a one-off outlier. These are the marathon walks — the far tail of Figure 1 made concrete.
| Rank | Path length | Score | |
|---|---|---|---|
| #1 | 3,644 | 20 | |
| #2 | 3,632 | 20 | |
| #3 | 3,618 | 19 | |
| #4 | 3,561 | 20 | |
| #5 | 3,537 | 20 | |
| #6 | 3,519 | 20 | |
| #7 | 3,482 | 20 | |
| #8 | 3,465 | 20 | |
| #9 | 3,457 | 19 | |
| #10 | 3,450 | 18 | |
| #11 | 3,448 | 20 | |
| #12 | 3,442 | 20 | |
| #13 | 3,411 | 19 | |
| #14 | 3,325 | 18 | |
| #15 | 3,323 | 20 | |
| #16 | 3,310 | 19 | |
| #17 | 3,294 | 19 | |
| #18 | 3,293 | 18 | |
| #19 | 3,292 | 18 | |
| #20 | 3,286 | 19 |
The merged files
telemetry clients _filesEverything above derives from these eight files — the output of the combine step, one row per distinct value or cell. The builder reads them once (streaming the two X,Y heat files in a single binning pass) and bakes this board's snapshot; the page itself never touches the CSVs.
| File | Columns | What it is | Rows |
|---|---|---|---|
| combined_pathlengthdistro.csv | PathLength, Frequency | How many walks lived exactly N steps. | 3.1K |
| combined_path_distan_distribution.csv | PathLength, Frequency | End-to-end (Euclidean) distance from home. | 396 |
| combined_path_maximu_distribution.csv | PathLength, Frequency | Farthest radius each walk reached. | 403 |
| combined_path_metros_distribution.csv | PathLength, Frequency | Manhattan distance at death. | 530 |
| combined_pathdirections.csv | DX, DY, Count | How often each of the 8 step directions was taken. | 8 |
| combined_node_visits.csv | X, Y, Number of Visits | Every cell the fleet ever stepped on, and how often. | 405.1K |
| combined_node_deaths.csv | X, Y, Number of Deaths | Every cell a walk trapped itself on. | 249.3K |
| combined_top_20_path_lengths.csv | Rank, Path Length, Score | The longest walks, merged from every reporting client. | 20 |
⭳ Download the snapshot (JSON) everything this board renders, in one small file
combined_samples_summary.json. All measurement, no decoration; the numbers are the uncensored
[POP] population, cross-checked against the per-path [LIB] library on the Path Statistics board.